• [email protected]
dsp.systems
  • Jurnal
  • Theory
  • Mathematics
  • Implementation
  • Dictionary
  • About
Sign In

Signal Features introduction

ValkanPavlov Jurnal 18 August 2026

When a signal passes through the Fast Fourier Transform, we obtain its frequency spectrum. This is an array of numbers that show the amplitude of each frequency present in the signal. For an audio recording a few seconds long, with a sampling rate of 44.1 kHz and a window size of 2048 points, the spectrum contains about 1024 values per frame. If frames shift every 10 milliseconds, we get roughly 100 spectra per second, or over 100,000 numbers in total. For an entire song, this amounts to millions of values.

Working with such a large amount of data is impractical. When we want to compare two signals, track changes over time, or detect anomalies, we need a more compact representation. Instead of working with entire spectra, we can extract a few numbers from them that capture the essential properties of the signal. These numbers are called features.

But features are not just a means of compression. Their primary purpose is to turn the signal into something that can be compared, recognized, and classified. When a speech recognition system needs to determine which word was spoken, it does not compare the recording directly with thousands of other recordings – that would be too slow and noisy. Instead, it extracts features from the signal (most commonly MFCCs) and compares this compact set of numbers with precomputed features of different words. Similarly, when we want to determine whether a machine is operating normally, we can monitor its vibration features – shifts in the spectral centroid, changes in the crest factor, or the appearance of new peaks. These numbers become a "fingerprint" of the system's state.

Some features are easy to interpret. The spectral centroid, for example, shows where the mid-frequency balance of the signal lies – whether the sound is darker or brighter. The spectral roll-off gives an idea of where the significant energy ends. Other features require more explanation. MFCCs, for instance, pass the spectrum through filters that mimic the human ear and return coefficients that have proven exceptionally useful for speech recognition. Chroma features group energy according to musical semitones and are used for harmonic analysis.

In this article, we will examine the main types of features – spectral, cepstral, chroma, modulation, and some time-domain ones. We will focus on definitions, computational steps, and the meaning of the resulting values. Machine learning remains aside – this is about pure DSP mathematics and how a signal can be described by numbers that carry meaning.

From Spectrum to Features – Graphic Example

The plot below shows a single spectral peak centred at 500 Hz. From this spectrum, we extract three compact features:

  • Spectral centroid (orange line) – the centre of mass of the spectrum. With a single, symmetric peak, it aligns exactly with the peak frequency.
  • Spectral spread (shaded region) – the width of the spectrum around the centroid.
  • Spectral roll-off (red line) – the frequency below which 85% of the energy is contained.

These three numbers describe the entire spectrum in a compact, meaningful way.

Observation: The centroid is exactly at 500 Hz. The spread captures the width of the peak. The roll-off sits where the tail becomes insignificant. This is the simplest and clearest demonstration of feature extraction.

Read the full article: Signal Features in the Frequency Domain →
Fourier transform introduction

ValkanPavlov Jurnal 18 July 2026

Imagine a piano chord — you hear a single sound, but it is actually a blend of several notes. The Fourier transform does the same for any signal: it reveals the individual frequencies hiding inside, showing not only which frequencies are present, but also how strong each one is.

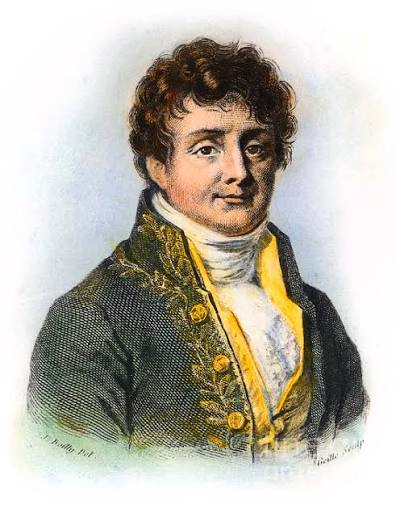
First introduced by the French mathematician Jean‑Baptiste Joseph Fourier in 1822, this idea revolutionised science and engineering. Fourier was studying heat transfer, but his method turned out to be far more universal. Today, it underpins everything from MP3 compression and speech recognition to radar, medical imaging, and even the detection of gravitational waves.

This article explains the Fourier transform step by step — from the continuous version through the DFT to the FFT that makes real‑time analysis possible. It includes interactive plots, a practical example, and a clear explanation of magnitude, phase, and filtering in the frequency domain.

Continue reading: The Fourier Transform: From Time to Frequency — a complete guide with examples, interactive plots, and practical applications.

From Continuous to Discrete: The s‑plane and z‑plane

ValkanPavlov Jurnal 26 May 2026

Digital signal processing builds upon concepts from continuous‑time systems. The bridge between the two worlds is the z‑transform, which maps the familiar s‑plane (Laplace domain) into the discrete‑time z‑plane. Understanding this mapping is essential for anyone designing digital filters or analyzing discrete‑time systems.

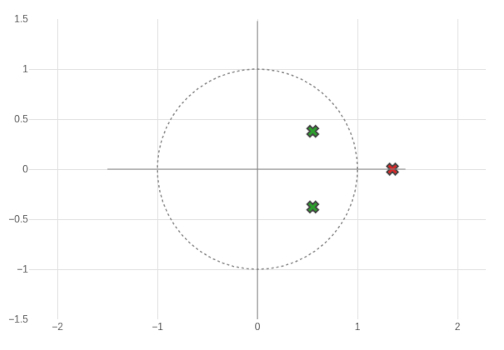
In the s‑plane, stability depends on whether poles lie in the left half‑plane. In the z‑plane, the condition becomes whether poles lie inside the unit circle. The transformation $z = e^{sT}$ preserves stability and reveals how key properties such as damping and natural frequency translate into the discrete domain.

z-plane stability diagram

This method is fundamental for stability analysis and system behaviour prediction in digital filters and discrete‑time systems. The z‑plane provides a rich geometric interpretation: the radial distance from the origin determines the damping (how fast transients decay), and the angular position determines the frequency of oscillation. Poles inside the unit circle (|z| < 1) guarantee stability, with smaller radii corresponding to faster damping. The angle measured from the positive real axis, converted to continuous‑time frequency via $ω = θ/T$, reveals the resonant frequency of the system. This unified framework simplifies both analysis and design.

Full article: s‑plane to z‑plane: Poles, Stability and Transformation — a complete guide with examples, figures, and exercises.

Reference: Bob Meddins, Introduction to Digital Signal Processing, Butterworth-Heinemann, 2000.

Window Functions in Digital Signal Processing

ValkanPavlov Jurnal 16 April 2026
  • Window function
  • Spectral leakage

In digital signal processing (DSP), window functions are mathematical functions w(n) that are multiplied by a finite segment of a signal x(n) to produce a “windowed” signal:

\[ x_w(n) = x(n) \cdot w(n) \]

Window functions are nonzero only over a limited interval and typically taper the values toward zero at the edges of the segment. The main reason for using them is that, in practice, we work with finite excerpts of a signal, while most analyses assume the signal is periodic.

Read more: Window Functions in Digital Signal Processing
© 2026 dsp.systems
  • Jurnal
  • Theory
  • Mathematics
  • Implementation
  • Dictionary
  • About